About the New Business Formation Report
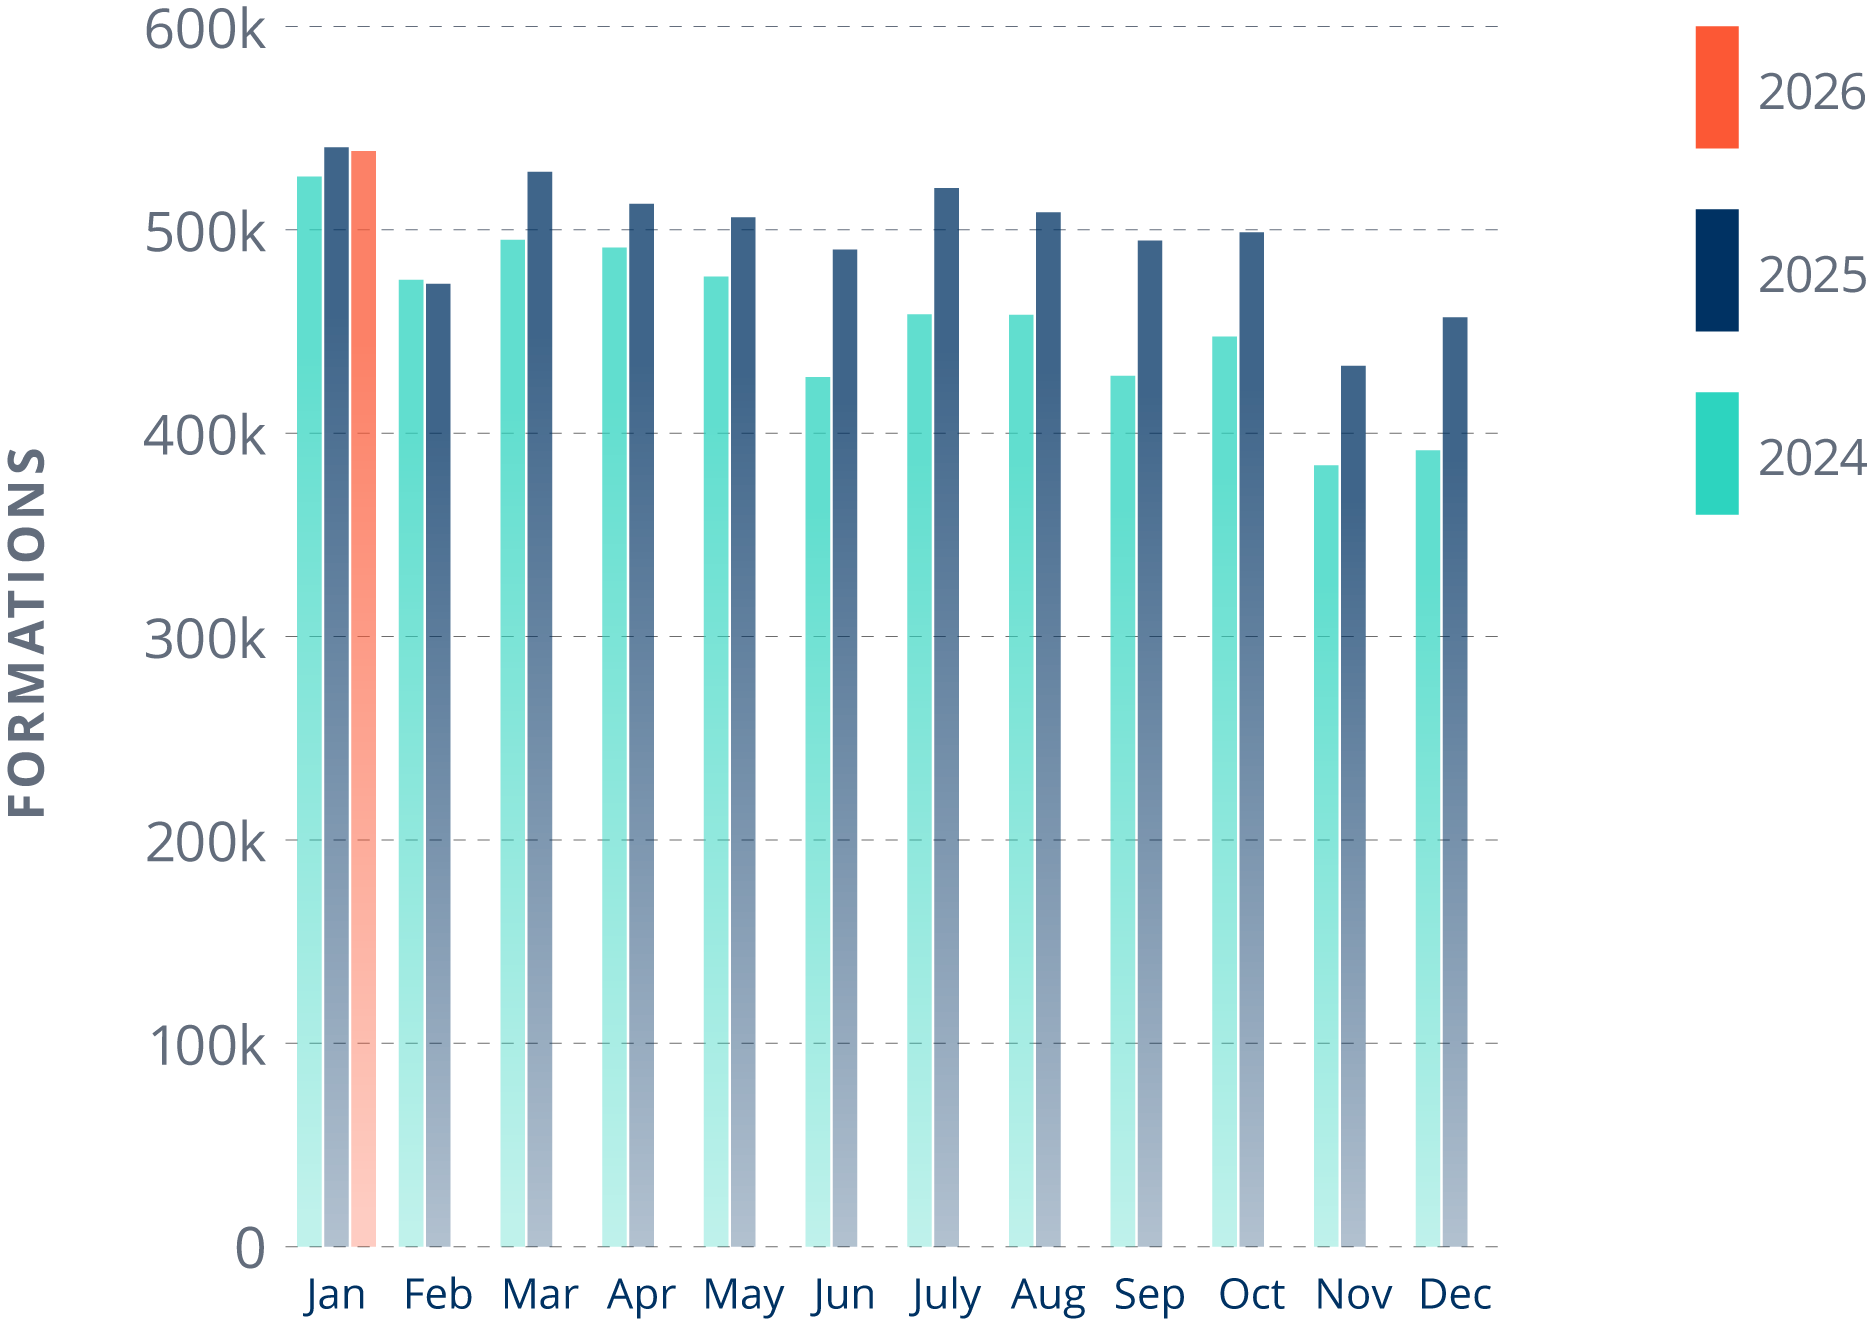
Because Registered Agents Inc files more business formations than any other provider in the US, our systems regularly track monthly business formations in every state. In our New Business Formations Report, we make that data free to economists, journalists, policymakers, and industry stakeholders every month.
Our report is the most recent data available on business formations in the US, and the only report that breaks down new entities by state. Unlike the US Census Bureau report, our report tracks every new formation in every state, including entities that never apply for an EIN or pay payroll taxes.

How to Use this Report
The New Business Formations Report captures business owners at the paperwork stage. Every time someone forms a legal entity at the state level, we count it as one business formation. Our data is drawn from state-level secretary of state or equivalent agencies’ databases and collected here. When considered in tandem with other sources and industry trends, business formation data can help policymakers, journalists, and founders with the following:
Anticipate Regional Shifts
Following upticks or dips in new business formations across the country can help spot trends that may indicate economic health in different regions. This can provide insight into emerging industries and investment opportunities.
Assess Policy Impact in States
A sharp increase or decrease in business creation that coincides with recent policy change can reveal the impact of local regulatory changes and help policymakers assess whether policies drive or hinder economic development.
Gauge Economic Confidence
Our report captures entrepreneurs at the “paperwork stage” of starting a business. This is one of the earliest stages of the business journey, indicating economic optimism and confidence.
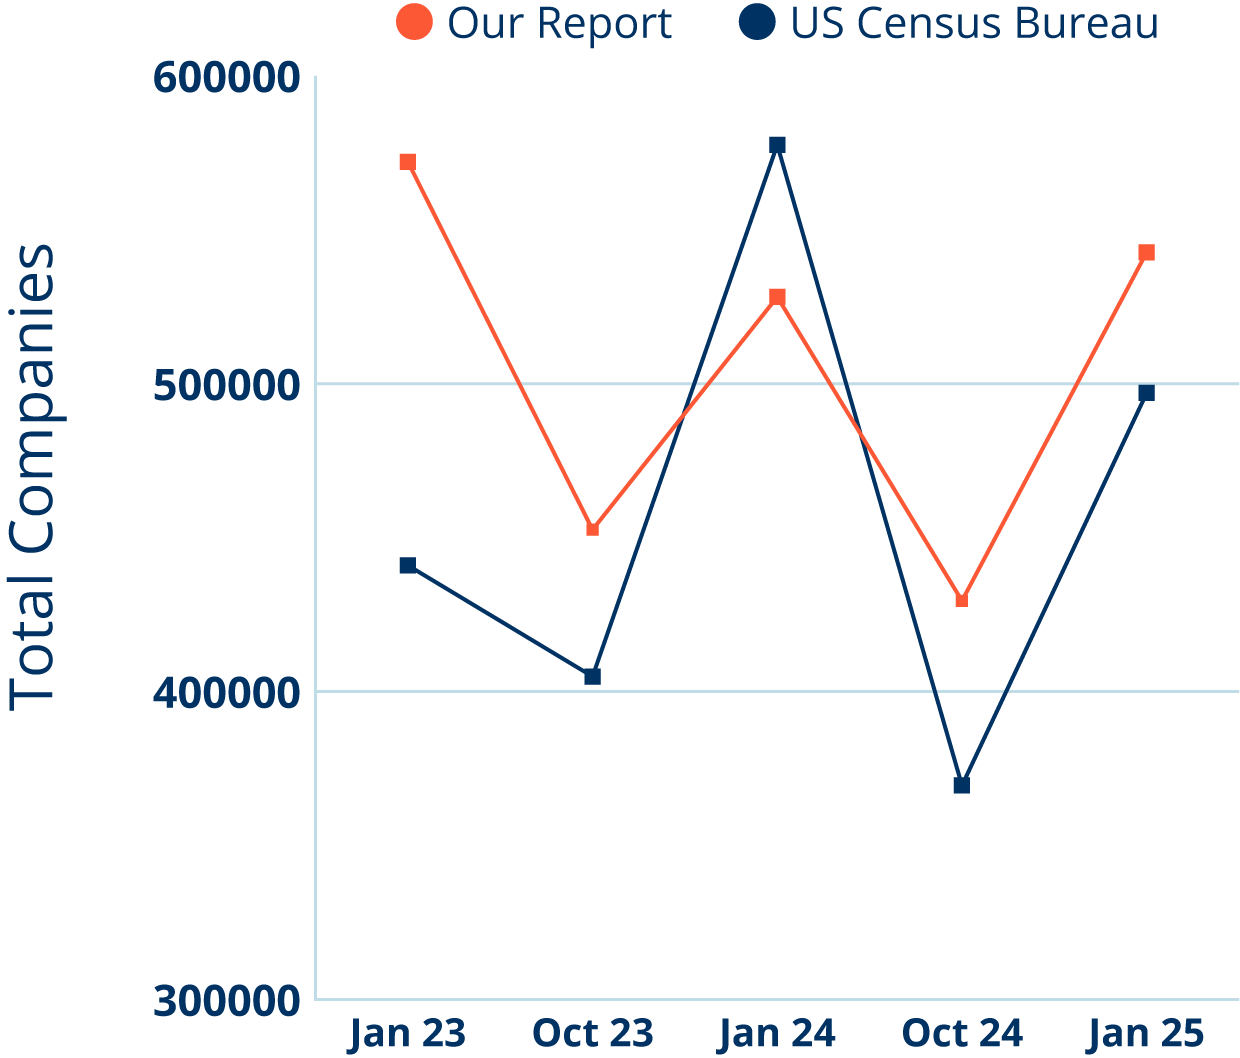
Our Data Vs. The U.S. Census Bureau Data
The RAI New Business Formations Report and the U.S. Census Bureau Business Formation Statistics both track business formation trends across the country. Each report captures the data at a different stage in the process.
- The U.S. Census Bureau tracks businesses that apply for EINs and later go on to pay payroll taxes.
- The RAI New Business Formations Report tracks every entity formed at the state level.
Because the U.S. Census Bureau only tracks EIN filings, the statistics the agency reports do not capture a complete picture of business formations in the country. A large portion of new businesses never obtain an EIN or go on to hire employees, and these businesses are not counted by the U.S. Census Bureau.
We Capture All Business Formations
The RAI New Business Formations Report counts all new business entities. Each time someone takes the step to file formation paperwork with their state’s secretary of state or equivalent agency, our report counts that as one formation. This is regardless of whether or not the business goes on to apply for an EIN and pay payroll taxes.
Note: Our data is based on the most recent numbers available. As state agencies begin to report more accurate data, we may update some numbers.
We Release The Most Recent Data
Our data is available the second Tuesday of every month and covers the most recent month. Because there is often a lag between the time someone forms an entity and applies for an EIN, our numbers reflect a more up-to-date snapshot than the statistics offered by the U.S. Census Bureau. Our report reflects the number of new businesses formed the previous month, every month.
We Break Down Formations by State
Our report is the only report available that breaks down business formations in the previous month by state. Rather than providing a federal-level count of EIN applications, we provide a state-by-state breakdown of new entities, which can allow insight into regulatory impacts, regional booms, and the effects of population growth, among other trends.
Learn more about Registered Agents Inc.
Frequently Asked Questions
Who creates the Business Formation Report?
A team of data analysts, software engineers, customer service representatives and writers at Registered Agents Inc works together to compile the Business Formation Report each month.
Where does the data in the Business Formation Report come from?
Business formation data is collected from the Secretary of State or equivalent agency of each state, when it becomes available. Customer sentiment data is collected directly from clients to provide snapshot of economic outlook.
Is this report politically affiliated?
No. At Registered Agents Inc, we have one mission: to support small business owners at every step of their journey. Our mission, and the ways in which we fulfill it, is independent of any political leanings. We have no affiliation with political parties or politically driven groups.
Can I access past reports?
Yes! You can access monthly Business Formation Reports going back to September of 2024. Check out our Newsroom.
How should I interpret regional or seasonal fluctuations in business formation volumes?
Interpreting data requires a nuanced approach that cross-references other data points or resources. For example, fluctuations could be affected by policy changes, GDP growth, consumer confidence, interest rates, market demand, and even the weather.
Why do so many businesses file in Wyoming?
Many remote businesses choose to file in Wyoming because the state offers strong privacy protections. Wyoming is one of the few states in the country where LLC owners do not have to list their names and addresses on the public record (if they hire a registered agent).
Why are so many businesses formed in Delaware?
Delaware is a popular state to start a business in for a few reasons. First, it has strong privacy protections, allowing owners to start a business without listing their personal information on the public record. Secondly, there’s no state corporate income tax on income earned out of state. This benefits businesses operating outside of Delaware, but incorporated within the state.
What does the report consider a business formation?
Every time someone files Articles of Organization or Incorporation with their state business division, we count that as one business formation.
Unlike the US Census Bureau Business Statistics report, we do not differentiate between business entities that go on to hire employees and file payroll taxes. We count every entity formed, so our numbers include holding companies, single-member LLCs, and non-employer businesses.