-9%
Month over Month Change
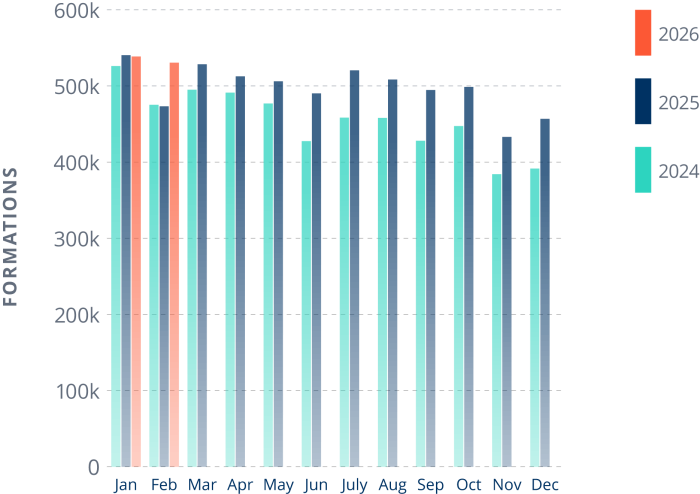
528,915
New US Business Formations
12%
Year over Year Change
Key Takeaways
- Business formations are up 12% year-over-year nationwide, despite typical seasonal softness and declining employment trends.
- Florida posted its highest monthly formation count on record, following a strong January rebound.
- Only three months in the past two years have outpaced this February’s formation totals.
- 42 states saw fewer formations from January to February, a routine seasonal pattern consistent with prior years.
- Montana and Idaho bucked the seasonal trend, jumping 20% and 17% month-over-month, respectively.
Business formation data is drawn from state-level filings, cross-referenced against U.S. Census Bureau data. Learn more.
Job Squeeze Continues to Fuel New Businesses
Hiring has been declining, and layoffs are on the rise. The Business Formation Report has been tracking the downstream effect of this trend for months, and a pattern is becoming impossible to ignore: as hiring becomes tighter, more Americans are choosing to start their own businesses.
February’s 12% year-over-year jump in national formations confirms this. In fact, over the last two years, only three months have posted higher totals than this February.
For workers and opportunity-seekers looking to build something of their own, entrepreneurship is increasingly the answer. This drive to build self-sustainability shows no signs of slowing.
Florida Sets an All-Time Record
Florida saw a strong rebound in January, but the state wasn’t done living up to its reputation as the country’s most active formation state. February brought 69,531 new formations to Florida, the state’s highest monthly total since the Business Formation Report began tracking it.
The 20% year-over-year jump says something real about Florida’s appeal to entrepreneurs, and it may mark a new baseline for the state.
February Dips—But Gives No Reason to Panic
Overall, month-to-month formations are down 9% from January—a drop that’s consistent with yearly trends. After January’s New Year’s Resolution wave of formations, February typically sees a cool-down; at just 28 days long, it’s simply working with less runway than any other month.
More importantly, the year-over-year data tells a different story: formations are up 12% compared to February of 2025, reflecting resilient underlying growth that short-term fluctuations can’t hide.
Montana and Idaho Move Against the Current
While 42 states saw month-over-month declines from January to February, Montana and Idaho moved in the opposite direction: Montana was up 20% month-over-month, with Idaho close behind at 17%, making them both standout performers in this month’s report. Both states have seen steady population growth in recent years: new residents bring new businesses.
For Idaho, that tracks directly with its standing as the second-fastest growing state by population. For Montana, it adds context to a state that already ranked second in formation growth nationally in our December ’25 report.
Nationwide Formation Metrics
528915
New Business Formations
-9%
Month over Month Change
12%
Year over Year Change
|
Location
|
New Businesses
Feb 2026
|
New Businesses
Jan 2026
|
% Change
|
New Businesses
Feb 2025
|
% Change
Feb 2025 v. Feb 2026
|
12 Month Avg.
Mar 2025 v. Feb 2026
|
|---|---|---|---|---|---|---|
| Alabama | 2954 | 3731 | -21% | 3169 | -7% | 3322 |
| Alaska | 1240 | 1272 | -3% | 996 | 25% | 1110 |
| Arizona | 12197 | 11243 | 8% | 11123 | 10% | 12036 |
| Arkansas | 3407 | 3738 | -9% | 3058 | 11% | 3312 |
| California | 43266 | 56854 | -24% | 387225 | 13% | 40506 |
| Colorado | 16260 | 17842 | -9% | 14571 | 12% | 15657 |
| Connecticut | 5368 | 5748 | -7% | 4730 | 13% | 5052 |
| Delaware | 28488 | 31920 | -11% | 24142 | 18% | 28414 |
| District of Columbia | 1449 | 1639 | -12% | 1410 | 3% | 1416 |
| Florida | 69531 | 67526 | 3% | 57273 | 21% | 59003 |
| Georgia | 17346 | 25753 | -33% | 20098 | -14% | 20527 |
| Hawaii | 2175 | 2441 | -11% | 2078 | 5% | 2146 |
| Idaho | 3924 | 3355 | 17% | 3643 | 8% | 3917 |
| Illinois | 14851 | 14595 | 2% | 12660 | 17% | 13859 |
| Indiana | 8619 | 9383 | -8% | 8012 | 8% | 8226 |
| Iowa | 3279 | 4074 | -20% | 3241 | 1% | 3410 |
| Kansas | 3417 | 3926 | -13% | 3027 | 13% | 3257 |
| Kentucky | 6273 | 6969 | -10% | 5371 | 17% | 6087 |
| Louisiana | 4929 | 5438 | -9% | 4882 | 1% | 5066 |
| Maine | 1405 | 1633 | -14% | 1358 | 3% | 1445 |
| Maryland | 7581 | 8336 | -9% | 7740 | -2% | 8109 |
| Massachusetts | 5880 | 7376 | -20% | 5550 | 6% | 6042 |
| Michigan | 10916 | 12092 | -10% | 12673 | -14% | 11995 |
| Minnesota | 6698 | 7109 | -6% | 6600 | 1% | 6662 |
| Mississippi | 5170 | 5141 | 1% | 3940 | 31% | 4519 |
| Missouri | 9596 | 10782 | -11% | 8147 | 18% | 9020 |
| Montana | 6406 | 5333 | 20% | 4711 | 36% | 5603 |
| Nebraska | 1886 | 1811 | 4% | 1979 | -5% | 1898 |
| Nevada | 6067 | 6917 | -12% | 5277 | 15% | 5755 |
| New Hampshire | 723 | 1108 | -35% | 553 | 31% | 892 |
| New Jersey | 14757 | 16641 | -11% | 13849 | 7% | 14674 |
| New Mexico | 4663 | 5169 | -10% | 4092 | 14% | 4503 |
| New York | 21424 | 24683 | -13% | 21304 | 1% | 22338 |
| North Carolina | 15354 | 14777 | 4% | 11324 | 36% | 14784 |
| North Dakota | 1434 | 1544 | -7% | 1069 | 34% | 1309 |
| Ohio | 14858 | 16268 | -9% | 13202 | 13% | 13936 |
| Oklahoma | 5530 | 6594 | -16% | 5212 | 6% | 5561 |
| Oregon | 8275 | 9077 | -9% | 5802 | 43% | 6655 |
| Pennsylvania | 9315 | 10685 | -13% | 11528 | -19% | 11612 |
| Rhode Island | 1358 | 1549 | -12% | 1196 | 14% | 1286 |
| South Carolina | 8961 | 8230 | 9% | 8140 | 10% | 8121 |
| South Dakota | 1138 | 1559 | -27% | 1296 | -12% | 1367 |
| Tennessee | 7878 | 9049 | -13% | 5514 | 43% | 6943 |
| Texas | 41632 | 45751 | -9% | 36536 | 14% | 39775 |
| Utah | 7781 | 7931 | -2% | 6866 | 13% | 5503 |
| Vermont | 1062 | 1166 | -9% | 820 | 30% | 1021 |
| Virginia | 13466 | 13784 | -2% | 840 | 24% | 12064 |
| Washington | 10457 | 10945 | -4% | 10386 | 1% | 9528 |
| West Virginia | 1597 | 1778 | -10% | 1595 | 0% | 1597 |
| Wisconsin | 6445 | 7570 | -15% | 5780 | 12% | 6142 |
| Wyoming | 20229 | 23319 | -13% | 16765 | 21% | 20755 |