3%
Month over Month Change
440,288
New US Business Formations
12%
Year over Year Change

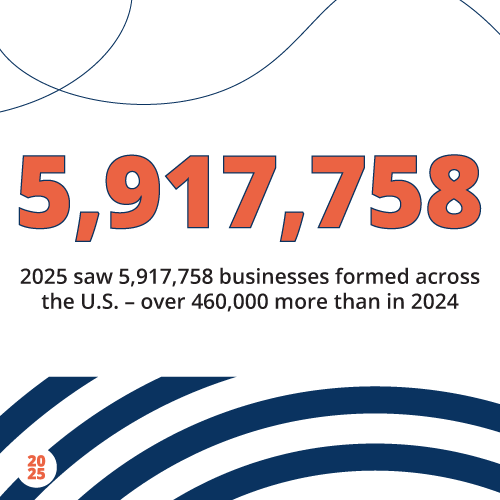
2025 Was Big for Business
The final numbers rolling in for 2025 formations confirm what monthly reports have hinted at all year: entrepreneurial drive and business momentum aren’t slowing down.
2025 saw an 8% year-over-year increase nationally, bringing the total to almost half a million more businesses formed than in 2024.
Whether this growth was fueled by post-election confidence or influenced by broader trends in work and ownership, Americans are showing up in a big way.
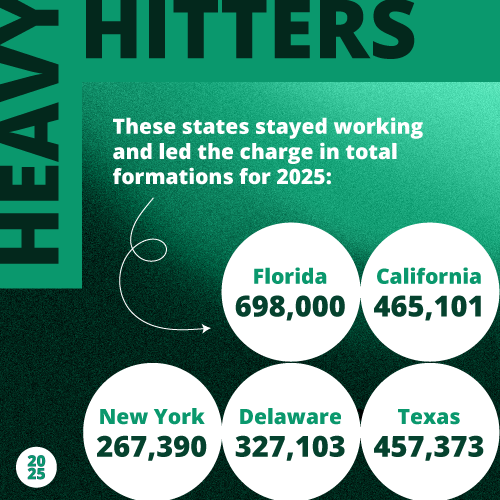
Where Business Was Booming
Florida once again left most states in the dust, continuing the momentum sparked by post-Hurricane Milton recovery efforts in late 2024. The Sunshine State led the nation in new business formations for 2025.
Texas and California also held strong, each surpassing 400,000 new formations and outpacing their 2024 totals by 10%. Both states secured a place in the top five for overall filings.
Delaware and New York also posted strong totals in 2025, each welcoming over a quarter‑million new businesses.
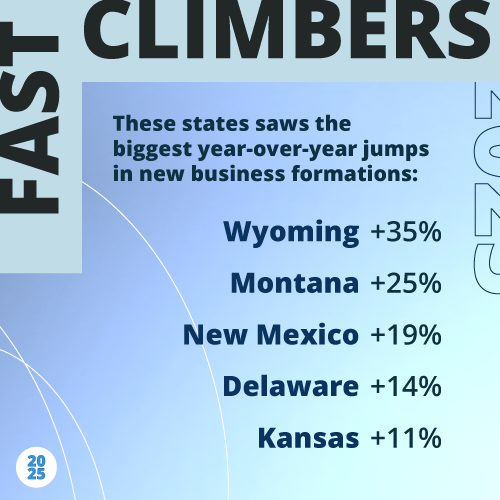
The States That Surged in 2025
Raw formation numbers are just one part of the story. Some states, like Wyoming, aren’t chasing national rankings; they’re simply aiming to outdo themselves. And in 2025, they did just that.
Wyoming saw a staggering 35% increase in new formations over 2024, outpacing the next closest state, Montana, by a full 10%. It’s a standout performance that signals continued business drive.
Still, every state in the top five growth bracket beat the national year-over-year average of 8%, including Kansas, which entered the conversation with a respectable 11% year-over-year growth.
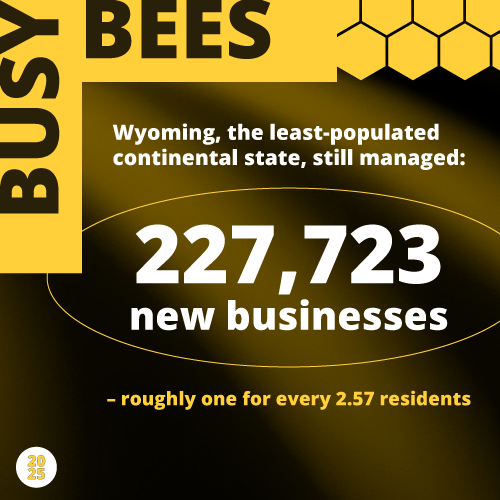
One State Outpaced The Rest
Wyoming may be small, but it made a big impression in 2025.
With an estimated population of just 585,484, the state recorded 227,723 new business formations—roughly one for every 2.57 residents.
Whether it’s the absence of a corporate income tax, low formation costs, or its business-friendly reputation, Wyoming continues to attract entrepreneurs from across the country. Few states come close to matching its per-capita entrepreneurial activity.
Key Takeaways
- 2025 closed out with an 8% increase in formations nationally, totaling 460,663 more than the year prior.
- Post-election-year tailwinds may have increased business filings through economic optimism and regulatory clarity
- Washington, D.C. slumped another 15% in December, compounding its November decline—possibly a lingering effect of the extended federal government shutdown.
- Wyoming enjoyed a banner year, up 7% from November and 35% above 2024
- Nevada spiked 15% over November, swinging high one last time and ending 2025 up 9% year-over-year.
Business formation data is drawn from state-level filings, cross-referenced against U.S. Census Bureau data. Learn more.
December Closed Out 2025 Strong
After an already impressive run, December contributed another 440,288 new business formations—rounding out 2025 on a strong note.
By the end of November, the year’s total formations had already nearly matched all of 2024. December’s surge served as an extra boost, pushing 2025 over by 460,000 formations.
This final push suggests that many entrepreneurs weren’t waiting until January to start fresh; instead, they used December to lock in their 2026 plans and hit the ground running.

Washington D.C. Continues Post-Shutdown Dip
Washington, D.C., grew its formations by 27% in October, likely spurred by the record-breaking 43-day shutdown of the federal government. It was a massive jump that few states could match. However, once the shutdown ended and government employees got back to work, the numbers dipped significantly.
New formations plummeted 19% in November, and then fell 15% in December. Our data shows only 1,091 new businesses were formed in the last month of 2025. This makes D.C. one of the very few jurisdictions ending the year on a visible downturn.
Nevada Enjoys One More Boost
Nevada ended 2025 with a 15% spike in December business formations compared to November, pushing the state to a 9% year-over-year gain and beating the national average.
A longstanding powerhouse in hospitality, tourism, and gaming, Nevada continues to attract entrepreneurs drawn to its business-friendly environment, especially the lack of corporate and personal income tax. Its reputation as a pro-privacy, low-regulation state, along with access to capital investment hubs like Las Vegas and Reno, may explain the continued interest in launching companies here.
Nationwide Formation Metrics
440288
New Business Formations
3%
Month over Month Change
12%
Year over Year Change
|
Location
|
New Businesses
Dec 2025
|
New Businesses
Nov 2025
|
% Change
|
New Businesses
Dec 2024
|
% Change
Dec 2024 v. Dec 2025
|
12 Month Avg.
Jan 2025-Dec 2025
|
|---|---|---|---|---|---|---|
| Alabama | 2534 | 2588 | -2% | 3677 | -31% | 3467 |
| Alaska | 1195 | 1061 | 13% | 911 | 31% | 1073 |
| Arizona | 10510 | 10058 | 4% | 9411 | 12% | 11646 |
| Arkansas | 2803 | 2731 | 3% | 2441 | 15% | 3250 |
| California | 33938 | 31119 | 9% | 28279 | 20% | 38758 |
| Colorado | 12864 | 13351 | -4% | 13345 | -4% | 15347 |
| Connecticut | 4754 | 4746 | 0% | 41004 | 19% | 4961 |
| Delaware | 25949 | 25469 | 2% | 22513 | 15% | 27259 |
| District of Columbia | 1091 | 1290 | -15% | 1022 | 7% | 1429 |
| Florida | 49979 | 50717 | -1% | 42761 | 17% | 58168 |
| Georgia | 14015 | 17226 | -19% | 15691 | -11% | 20149 |
| Hawaii | 1868 | 1886 | -1% | 1764 | 6% | 2044 |
| Idaho | 3435 | 3269 | 5% | 3132 | 10% | 3640 |
| Illinois | 12463 | 7892 | 58% | 12505 | 0% | 13225 |
| Indiana | 7257 | 7216 | 1% | 6801 | 7% | 8147 |
| Iowa | 2884 | 2821 | 2% | 2653 | 9% | 3297 |
| Kansas | 3002 | 2863 | 5% | 2600 | 15% | 3128 |
| Kentucky | 4724 | 4992 | -5% | 3948 | 20% | 5897 |
| Louisiana | 4031 | 4322 | -7% | 3888 | 4% | 4972 |
| Maine | 1229 | 1199 | 3% | 1330 | -8% | 1428 |
| Maryland | 5999 | 5435 | 10% | 6117 | -2% | 7369 |
| Massachusetts | 5219 | 5128 | 2% | 4572 | 14% | 5964 |
| Michigan | 10435 | 9619 | 8% | 10929 | -5% | 12167 |
| Minnesota | 5993 | 5523 | 9% | 5703 | 5% | 6549 |
| Mississippi | 3371 | 3586 | -6% | 3026 | 11% | 4240 |
| Missouri | 8163 | 8005 | 2% | 6903 | 18% | 8806 |
| Montana | 5797 | 5518 | 5% | 4314 | 34% | 5639 |
| Nebraska | 1776 | 1566 | 13% | 1735 | 2% | 1895 |
| Nevada | 6003 | 5202 | 15% | 4978 | 21% | 5610 |
| New Hampshire | 1171 | 1095 | 7% | 1571 | -25% | 842 |
| New Jersey | 13964 | 13212 | 6% | 11314 | 23% | 14512 |
| New Mexico | 3828 | 4022 | -5% | 3029 | 26% | 4339 |
| New York | 21145 | 19512 | 8% | 18629 | 14% | 22283 |
| North Carolina | 10417 | 11373 | -8% | 10161 | 3% | 13894 |
| North Dakota | 993 | 865 | 15% | 1029 | -3% | 1060 |
| Ohio | 12170 | 12303 | -1% | 10791 | 13% | 13670 |
| Oklahoma | 4735 | 4181 | 13% | 4244 | 12% | 5277 |
| Oregon | 7210 | 6357 | 13% | 5010 | 44% | 5933 |
| Pennsylvania | 11580 | 11428 | 1% | 10086 | 15% | 12346 |
| Rhode Island | 1106 | 1107 | 0% | 947 | 17% | 1262 |
| South Carolina | 7247 | 6692 | 8% | 6801 | 7% | 8072 |
| South Dakota | 1346 | 1216 | 11% | 1232 | 9% | 1372 |
| Tennessee | 5517 | 5756 | -4% | 5510 | 0% | 6547 |
| Texas | 36099 | 34534 | 5% | 31851 | 13% | 38114 |
| Utah | 2724 | 5623 | -51% | 227 | 1100% | 5384 |
| Vermont | 951 | 862 | 10% | 671 | 42% | 1007 |
| Virginia | 11258 | 10177 | 11% | 9195 | 22% | 11649 |
| Washington | 7877 | 7454 | 6% | 7945 | -1% | 9502 |
| West Virginia | 1161 | 1313 | -12% | 1159 | 0% | 1584 |
| Wisconsin | 5440 | 5157 | 5% | 4601 | 18% | 5999 |
| Wyoming | 19068 | 17889 | 7% | 14544 | 31% | 18977 |